Kubernetes Pods are the fundamental building blocks in a Kubernetes cluster. They encapsulate containers, storage resources, a network identity, and the options that govern how containers run. But how exactly do they move through their “life” from creation to cleanup? In this article, we’ll walk through the different phases and events that a Pod goes through, often referred to as the Pod lifecycle.
What is a Pod?
Before diving into the lifecycle, let’s recap what a Pod is:
- A Pod is the smallest deployable unit in the Kubernetes ecosystem.
- It usually contains one or more tightly coupled containers that share the same storage volumes, IP address, and namespace.
- Pods are ephemeral in nature: once a Pod is created and runs, it doesn’t “heal” itself; if something goes wrong, the Pod is replaced with a new Pod instead of being repaired in place.
Kubernetes Pods: Everything You Need to Know with YAML Examples
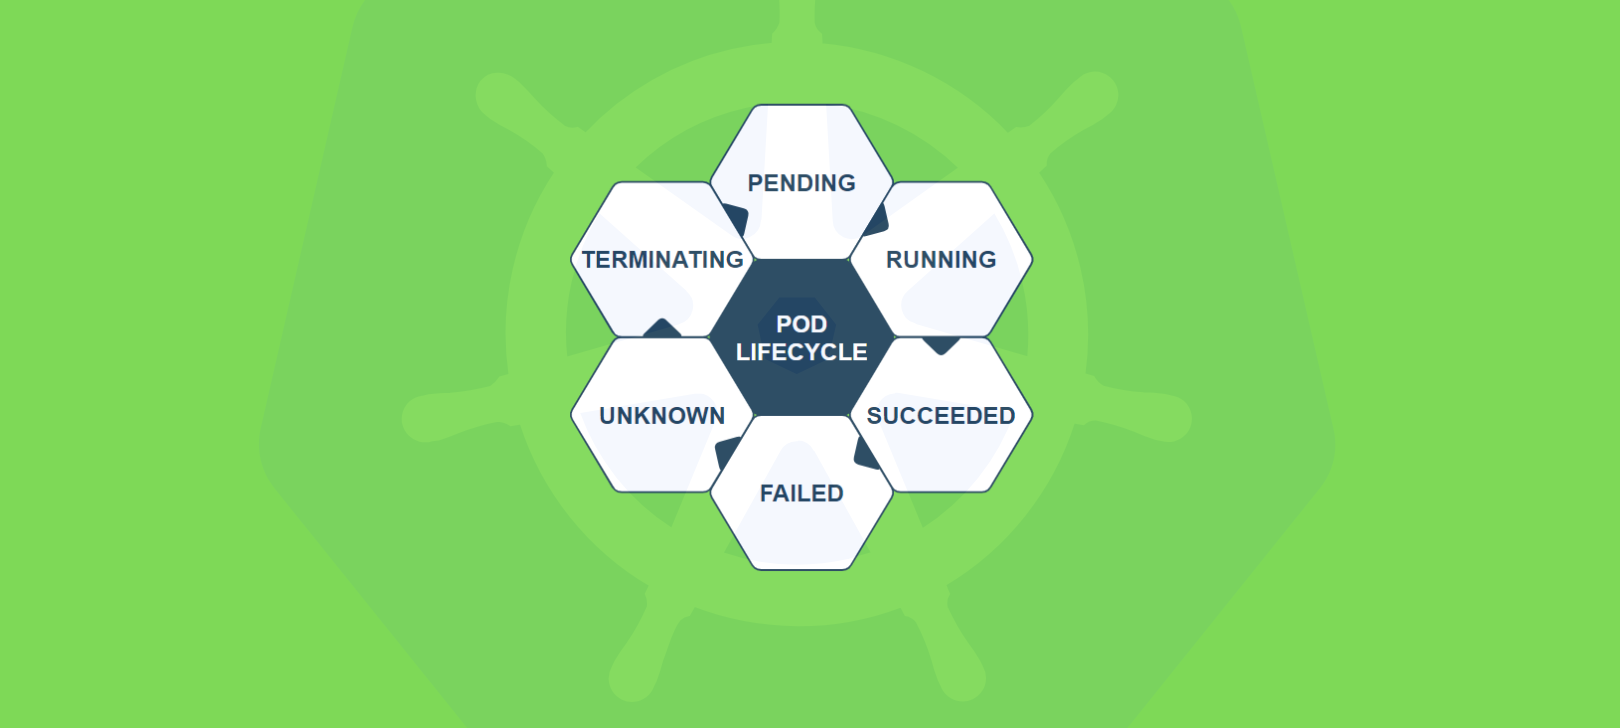
Pod Lifecycle Phases
The Kubernetes documentation outlines specific phases that a Pod can be in. These phases reflect the overall state of the Pod rather than the individual containers.

Let’s look at each phase in detail.
- Pending
- A newly created Pod starts in the Pending phase.
- This means the Kubernetes cluster has accepted the Pod, but one or more of the Pod’s containers are not yet running.
- Common reasons for a Pod to stay in
Pending- The scheduler hasn’t assigned the Pod to a Node yet.
- Pulling of container images is taking time or failing.
- There are insufficient resources (CPU/memory) on any Node to accommodate the Pod.
- ContainerCreating (sub-phase)
- Technically, you might see ContainerCreating as a status after scheduling but before the containers are fully running.
- Kubernetes is setting up storage volumes, networking, and pulling container images during this time.
- Running
- Once the Pod is scheduled onto a Node and the containers start without crashing, the Pod moves into the Running phase.
- This indicates that at least one container in the Pod is running (and all containers could be running successfully).
- Succeeded
- If a Pod’s containers all complete successfully (exit code 0) and the Pod’s restartPolicy is set to
NeverorOnFailure, then the Pod goes to Succeeded. - A Pod that runs to completion (like a batch job) and exits with no errors ends in the Succeeded phase.
- If a Pod’s containers all complete successfully (exit code 0) and the Pod’s restartPolicy is set to
- Failed
- If one or more containers within the Pod fail with a non-zero exit code, and the Pod’s restart policy doesn’t allow restarting (or restarts continuously fail), the Pod transitions to Failed.
- A failed Pod is essentially done, and Kubernetes will not restart it (unless specified otherwise in higher-level controllers like Deployments or StatefulSets).
- CrashLoopBackOff (sub-phase)
- If a Pod’s container keeps failing and restarting, you may see a CrashLoopBackOff status.
- This isn’t an official Pod phase in the same sense but a message indicating Kubernetes is backing off before trying to restart the container.
- Unknown
- The Unknown phase occurs when the state of the Pod cannot be determined.
- This usually happens if there’s a problem communicating with the Node hosting the Pod.
- Terminating (sub-phase)
- When you or Kubernetes decides to remove a Pod (for example, scaling down a Deployment or a manual
kubectl delete pod), the Pod goes into Terminating status. - Kubernetes gracefully stops all containers (sending SIGTERM, then SIGKILL if they don’t exist in time), detaches storage, and cleans up resources.
- When you or Kubernetes decides to remove a Pod (for example, scaling down a Deployment or a manual
Key takeaway: These phases help operators and developers understand whether a Pod is stuck pulling images, running properly, or has completed its life.
Events in the Pod Lifecycle
Alongside the phase of a Pod, Kubernetes also emits events that can provide clues about why a Pod is stuck or failing. To inspect Pod events, you typically use:
kubectl describe pod <pod-name>You might see events like:
- Scheduled: The scheduler has assigned the Pod to a Node.
- Pulling: The container runtime is pulling the container image.
- Created: The container runtime has created the container.
- Started: The container has started running.
- Killing: The container is being terminated for some reason (e.g., an update or scale down).
These events help debug any issues that might occur from scheduling to container startup.
Common Pitfalls and How to Avoid Them
- Insufficient Resources
- If your cluster Nodes are low on CPU or memory, your Pod may remain stuck in
Pending. - Use requests and limits judiciously, or provision more resources.
- If your cluster Nodes are low on CPU or memory, your Pod may remain stuck in
- Image Pull Errors
- A wrong container image name or lack of registry credentials can prevent the image from pulling.
- Make sure your container images are accessible and spelled correctly.
- Misconfigured Network Policies
- If your Pod needs network access, ensure you have the correct NetworkPolicy configurations.
- Mismatched network policies can lead to Pods not being reachable or lacking DNS resolution.
- Incompatible Node Architecture
- Ensure the image you’re pulling matches the Node’s underlying OS/CPU architecture (e.g., arm vs. amd64).
- CrashLoopBackOff
- This is often caused by a misconfiguration within the container or something failing on startup.
- Check container logs (
kubectl logs <pod-name> -c <container-name>) to see what’s causing the repeated crashes.
Best Practices
- Use Higher-Level Controllers: Instead of creating Pods directly, use Deployments, StatefulSets, or DaemonSets for long-running applications. These controllers can handle restarts, scaling, and updates more gracefully.
- Always Check Pod Events: When debugging, start with
kubectl describe pod. Events will reveal image pull issues, Node assignment failures, or resource constraints. - Set Readiness & Liveness Probes: Properly configured health checks help Kubernetes decide when a container is truly “ready” and when it needs restarting. This keeps your applications more robust.
- Leverage Logging & Monitoring: Tools like the Kubernetes Dashboard, Prometheus, Grafana, and EFK (Elasticsearch-Fluentd-Kibana) stack provide deeper visibility into Pod behavior.
- Write Idempotent & Stateless Code: Since Pods are ephemeral, design containers so they can start, stop, restart, or scale smoothly.